Building Out My Homelab Monitoring Stack
Notes from deploying Prometheus and Grafana and beginning to centralize monitoring across my Proxmox environment.
The Goal
I wanted better visibility into the health and performance of the systems running in my homelab.
Rather than checking each host individually, my goal was to create a centralized monitoring stack using Prometheus for metric collection and Grafana for visualization.
Environment
The monitoring environment currently includes:
- Proxmox VE hosts
- Linux containers and virtual machines
- Prometheus
- Node Exporter
- Grafana
Initial Deployment
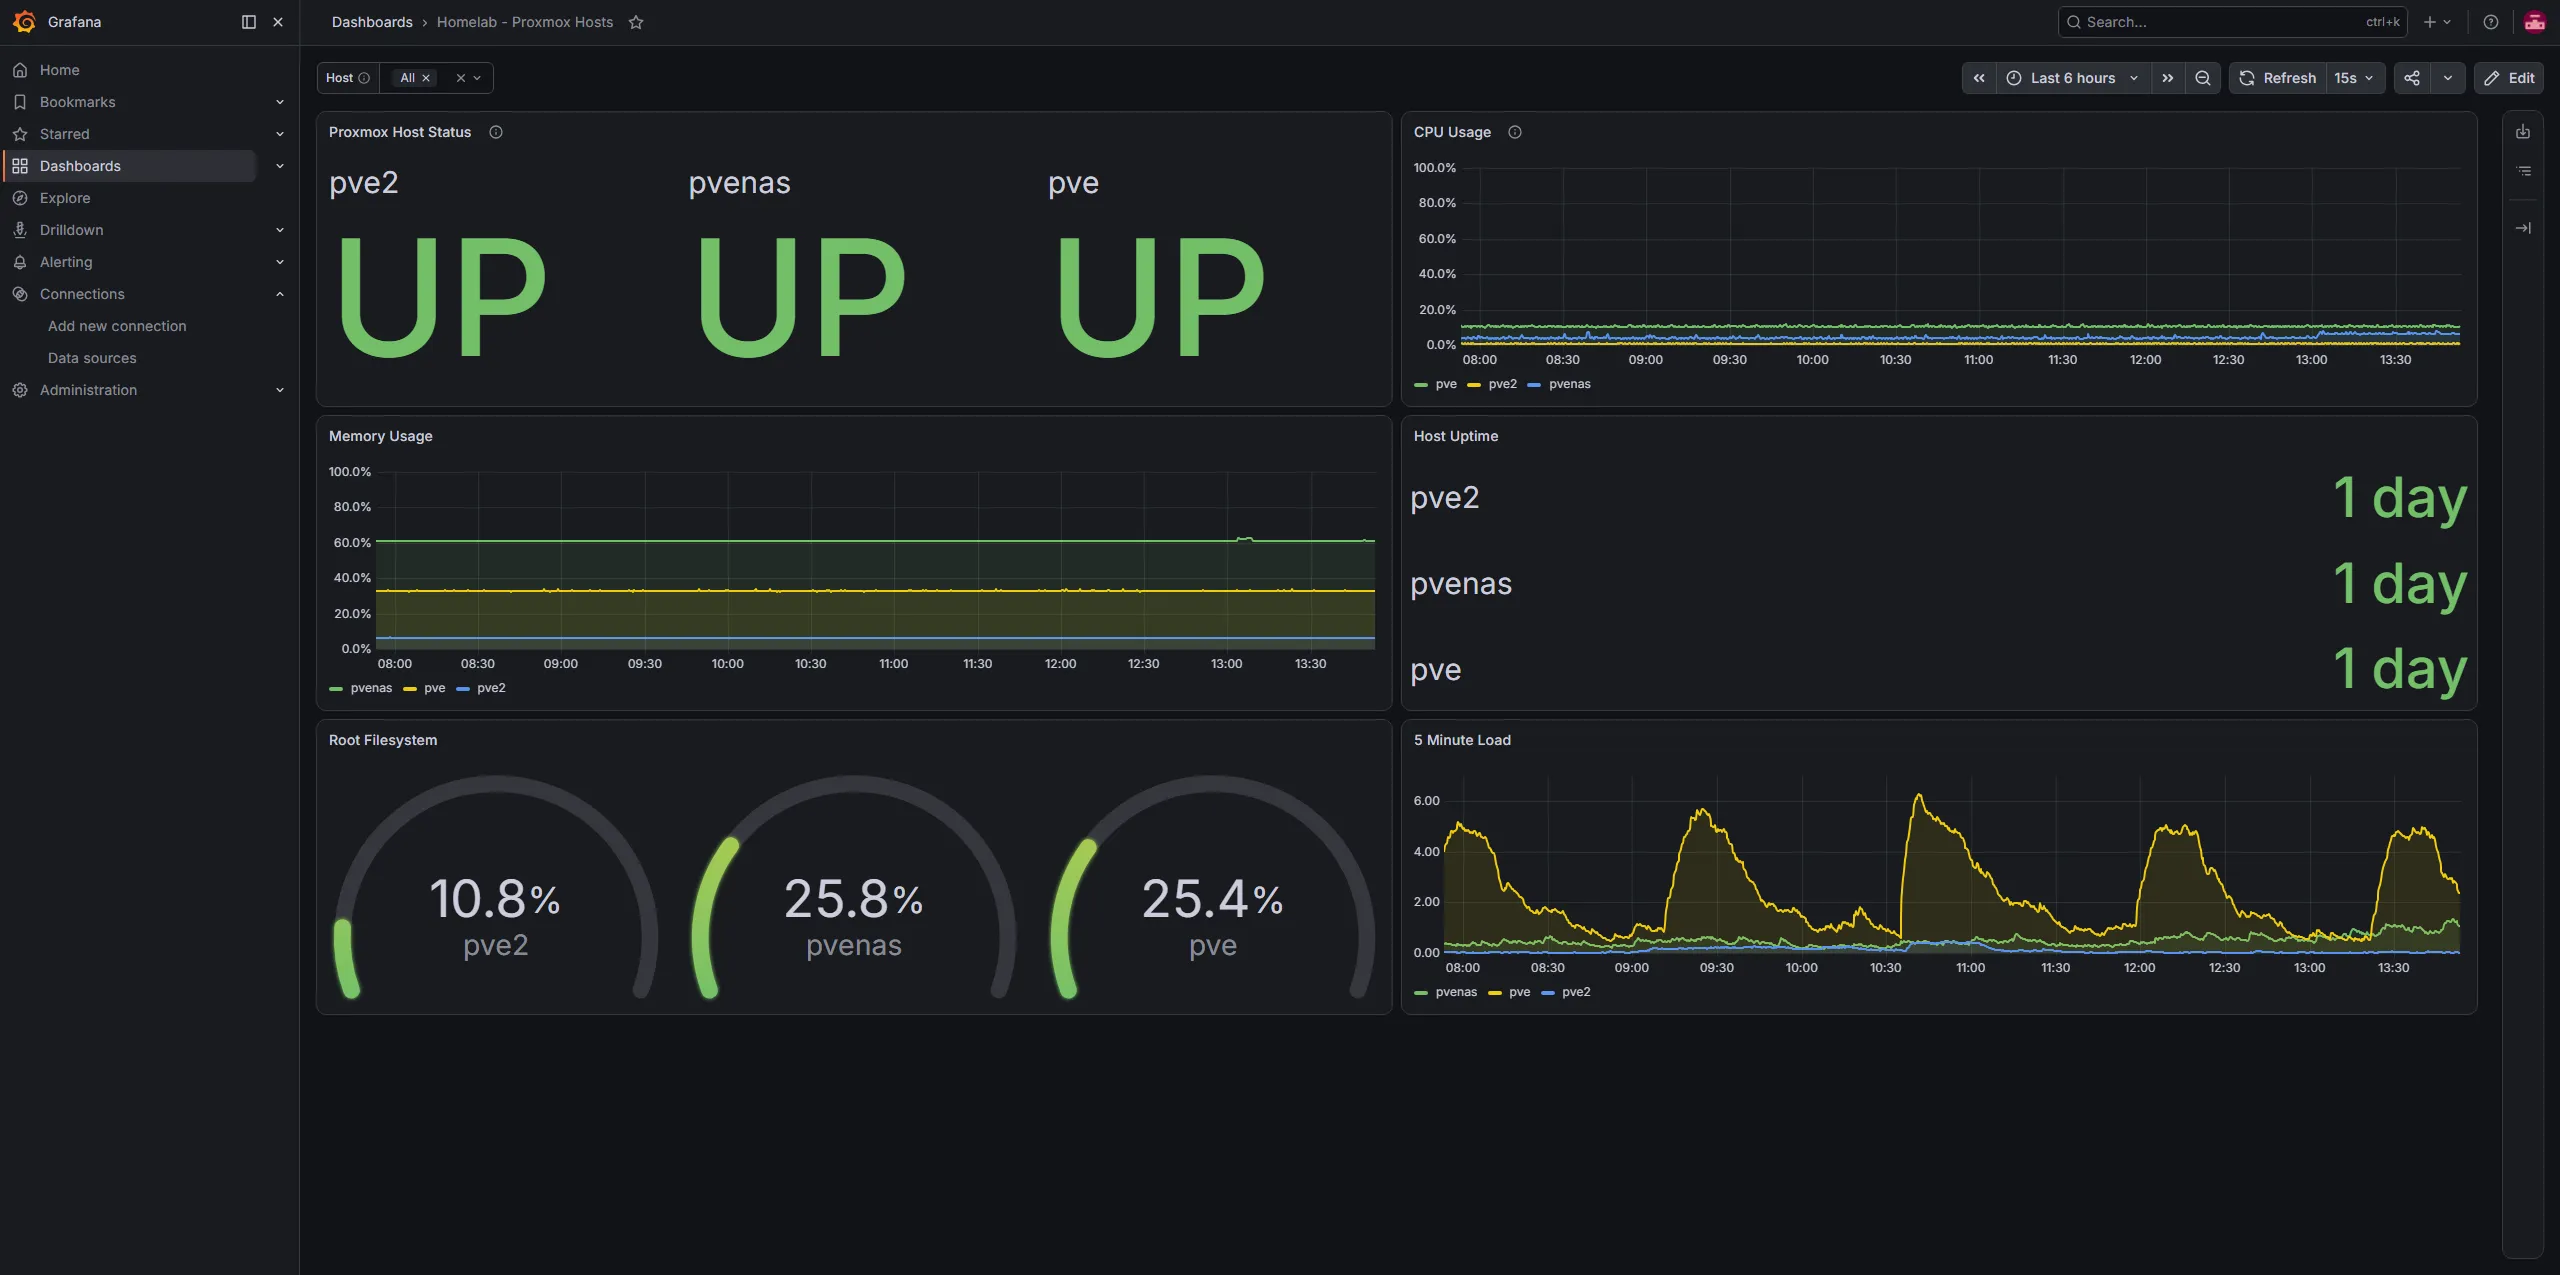
I deployed Prometheus and Grafana into the lab and configured Prometheus to begin scraping metrics from my infrastructure.
Once the exporters were communicating successfully, I started building the first Grafana dashboard manually instead of importing a prebuilt dashboard.
The goal is not only to have useful monitoring, but also to understand how the underlying metrics and PromQL queries work.
Problems Encountered
One issue appeared while building the dashboard: some of the expected sensor and network queries returned no data.
That meant the next step was not simply changing the visualization. I needed to determine what metrics were actually being exposed by Node Exporter and how the available series differed from the queries I was attempting to use.
What I’m Learning
This project has reinforced an important troubleshooting principle:
Verify the data that actually exists before designing around the data you expect to exist.
The monitoring stack is still evolving, and I plan to continue documenting the dashboard as additional metrics, alerts, and visualizations are added.